Blog about (Web-) Programming, Graphics and Games.

Posts mit dem Label Canvas werden angezeigt. Alle Posts anzeigen

12.12.2016

Happy Feast of Winterveil!

Last blogpost of this year, everyone a good transition to 2017! Assembled 2 2D javascript experiments. First has a walking and tumbling Santa Claus with randomly generated snow flakes. Second renders vegetation, moving as a frog runs through it.

► Start Santa Claus
► Start Vegetation


31.01.2014

cutout.js - Game Test

The animation project of a previous blogpost is now extended to a game experiment, with following features:
  • Canvas or WebGl renderer via menu
  • Stereo WebAudio synth effects
  • Particle system
  • Various controls depending on system and browser: keys (wasd,cursor,ctrl), mouse, touch or gamepad
Game mission is to fight the mobs. Health regenerates over time. One should only fight single ncps at once. Current quest is to finish the game in less than 264.9 seconds. :)

►Start game
►Github repository

11.09.2013

cutout.js - Javascript Cutout Animation

This project provides javascript cutout animation, inspirated by Monty Python and others. A first case study is a swinging Mona Lisa. Click the links to start the animation or to browse the project at github.

►Start canvas 2d
►Start webgl
►Github repository


Some notes on how the project was developed.
  • At first there was the canvas 2d version. For browsers, that dont have hardware accelerated sprites, and to compare performances, a webgl version was implemented.
  • Another canvas demo, which tests performance of transparent transformed sprites and was made before the cutout project, is here.
  • The cutout segments are drawn using matrix operations. The canvas 2d api originally didnt had a method to read a current matrix. This is added currently (context.currentTransform). Until it is in every browser, own matrix manipulation using vecmath.js is done.
  • Cutout segments are taken from one partly transparent image. It was drawn with the web paint app and following steps:
  • The canvas-width of the original Mona Lisa image was doubled (Menu/Edit/Dimension), so that the original image is on the left, transparency is on the right side.
  • Cutout segments were cut from the original image (Menu/Tools/Rect) and copied to the right side. Then transparency around them was drawn with Menu/Tools/Eraser.
  • Finally, when all segments were done, the original image needed to be changed so that it constitutes the background. To dont have to draw new background, where Da Vinci didnt bothered, there is Menu/Tools/CopyBrush. With this tool the original background areas were multiplied, so that they covered the whole image.

10.05.2013

Visualize (and replay) notes without notes

The goal is to display piano notes without using musical notation. Notes are shown on top of piano keys. To replay them, the library MIDI.js and with it e.g. WebAudio is used. The image shows the progress of compactifying the display, where first only needed keyboard keys are drawn, and second repetitions are not redrawn.

►Start

Recognize the music? Solution: ⅁N∩HƆS∩Ǝ∀⊥ 'ƎSIƎᴚᴚƎ⊥NIM ⊥ᴚƎ𐐒∩HƆS

19.03.2013

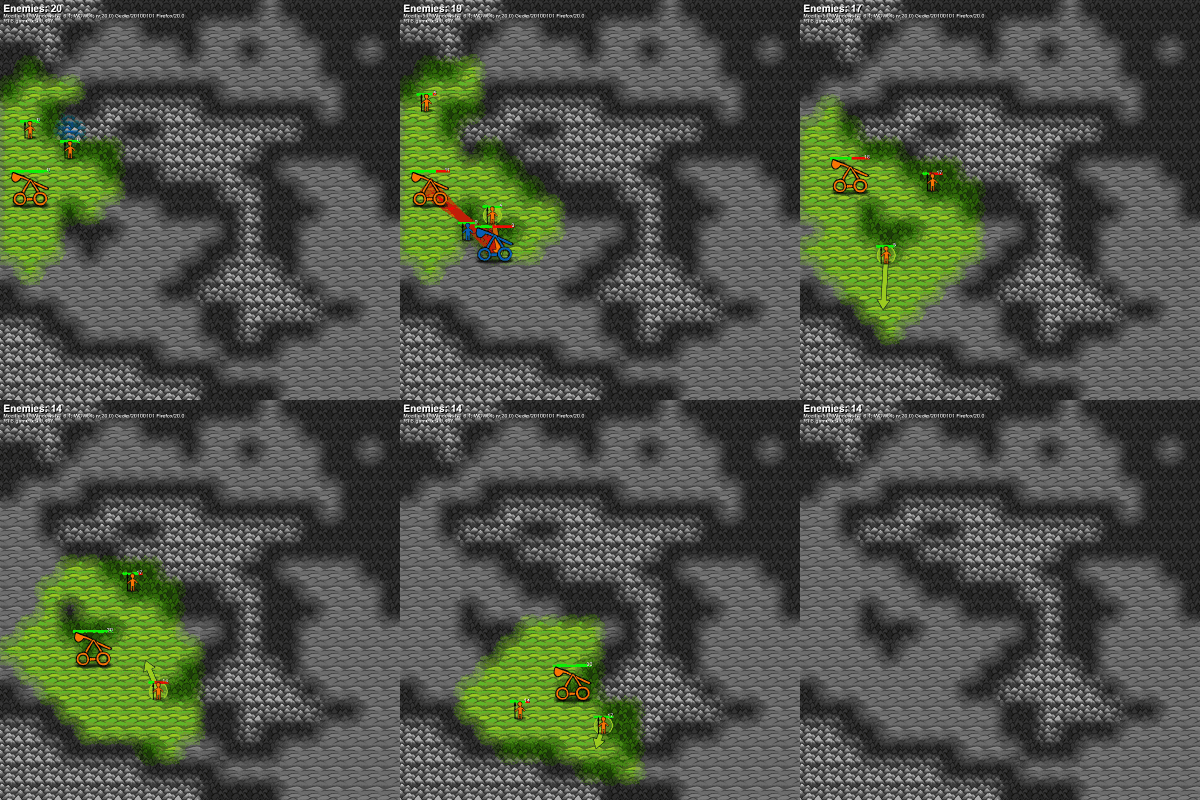
Strategy game experiment

This is a strategy game experiment. A goal is multiplatform, so that it can be played on phones and (even more appropriate) on tablets. Again the textures are made with the web paint app WePaint.

►Start

Update 4.4.2013: Gameplay is added, it consists of following points:
  • Its is basically real time strategy (RTS), all units can move at the same time.
  • A goal was very simple gameplay (with mobile devices in mind). To move is the only command for units. They attack automatically, if there is something in range. To stop an attacking unit, it as to be moved out of range.
  • The map consist of 3 different landscape tiles: lowland,forest,mountains. They affect view range, unit velocity and attack/defense. Lowland has best view range, highest unit velocity and worst attack/defense. Mountains has opposite values and forest is inbetween.
  • There are 2 kind of units, melee and ranged (catapult). Melee attack at near range, ranged units attack at far range but not at near range.
  • Units have hitpoints that regenerate over time. If a units lost all hitpoints, it is removed.
  • Each unit also has experience points, which increase during attacks. The more experience a units has, the better it attacks and defends.
  • Game mission is to defeat all the enemies.

Update 12.4.2013: Games can be recorded and replayed as gif. Resulting gif images are quite small, because 6bit palette and incremental draw is applied (using the library omggif.js).

14.01.2013

WePaint - Web paint app

A new project started: The web based paint app 'WePaint'. Why? I looked for a paint program, which is able to handle:
  • transparency (alpha channel),
  • animated sprites,
  • logging and replay of paint operations.
Also I looked for a paint program for Nexus7, or better, a program that
  • runs on mobile platforms and on desktop. This is also needed, because later
  • it shall be used a texture paint component for the web 3d editor.
That are the goals for the project, it can be tested here:

►Start

There is currently following detail functionality:
  • Save/load images via localStorage.
  • Import/export images via dataUrl, png format.
  • Import/export paint operations(processes), text format.
  • Gif export of animated sprites and processes. Done with a gif encode library.
  • 4 paint tools: brush, erase, unerase, select and copy rectangle areas
The images of this blogpost are all created with the app. Currently there is no further documentation, functionality is still changing.

Update: Added pattern draw mode: Brush strokes repeat over the image borders, so that the resulting pattern looks borderless. The mode can be set by Menu>Edit>PatternBrush.

Update 27.1.2013: Added normal texture editing. Diffuse, normal and specular textures can be handled as 3 pages. Textures can be displayed alone or combined, where a lightsource is simulated.

28.09.2012

Javascript demos: Description logics and 2D Physics + Nexus 7/Android impressions

Description logics Rules can be defined, which then can be queried. The implementation is a simple description logics tableau resoner. Basic queries are of subsumption type, they ask if a concept subsumes another concept. Subsumption can be seen as is-a relation. Of multiple concepts a subsumption hierarchy, aka taxonomy, can be calculated and displayed.

2D Physics The demo is based on connected particles. Particles can be dragged and thus things go into motion and rotation. On top of this particles a vector graphics is drawn, which moves and deforms with underlying particles.

Nexus 7/Android impressions I got me this device and do quite like it. Programming-wise it made me explore some javascript apis, that I not much worked with before: touch-events, tilt-events, fullscreen, localStore. I tested with Chrome and Firefox Beta. Browsers still not support everything, but I hope that changes. Also I finally played some Minecraft PE. :)

12.03.2012

3 Canvas demos

Long time no update for this blog. Here are 3 smaller canvas demos, that were created during that months.

Army of the Immortals. A simulation of mortal and immortal entities, which might illustrate, why natural evolution hasnt created immortality yet.

Perspective texturing. Using baryonic technique textures are drawn on canvas. This can result in artsy pictures.

Image viewer. Scrollable, zoomable with mouse(-wheel) and keyboard. With minipicture.

26.07.2011

Canvas experiment: Penrose Tiling

I experimented with an algorithm which generates a penrose tiling. This pattern consists of 2 tiles: and is non-periodic (never repeats itself).

►Start demo

The current algorithm is still suboptimal, there remain gaps in the pattern. The algorithm works as follows: Before a tile is added, the local neighborhood is checked for upcoming conflicts. Since only a local environment is checked, there can still emerge conflicts (gaps) for the global pattern. To improve the algorithm, one could introduce heuristics or make it interactive: a user could remove pattern areas which contain gaps. Then the generating could be restarted in this areas. (The demo is inspired by an article in the journal Spektrum d.W.)

28.05.2011

Canvas experiment: Build order simulator

The demo simulates build orders as of RTS games (e.g. Starcraft2). Here buildorders are very simplified, there is only 1 structure, the central; 2 unit types, worker and knight; and 1 resource, gold. To build those, gold must be paid. Workers harvest gold. Centrals produce units, the more centrals and gold exists, the faster units can be produced. The history of the build is displayed as graph. If the simulation is restarted, history graphs of previous runs are kept and displayed too, this allows to optimize a builder order.

26.11.2010

CanvasCraft - towards a web RTS game (²)

A previous blogpost is also transcribed with 'towards a web RTS game'. There I focussed on webgl graphics. This time the focus is the game core engine, thus here graphics are very simple, units are drawn as circles using canvas. Conceptually, once the game core engine is finished, one could combine both approaches and get a game demo with improved gameplay and graphics.

In this demo units can be selected via mouseclick, by mouse-dragging a rectangle around some, or via numeric keys (e.g. shift-1 constitutes a group of previous selected units, key 1 then selects this group). Selected units can be moved by rightclicking on the ground or on another unit. By pressing key P the game pauses.

There are units of 2 different parties (blue-you/orange-computer). If units of different parties approach they will fight each other. There are 2 unit-types: slow ranged and fast melee. The game is over, if all units of a party are gone. The filesize of the javascript code is ~12kB.

04.10.2010

HistoryMaps: Migration period (Völkerwanderung) 150-500

On the left there is a first version of a HistoryMap. HistoryMaps are a concept to display historic developments, both in place and time. They combine traditional maps, which display places but no different times, and timelines, which show timepoints but no referring places. This first HistoryMap shows movement of tribes and battles during the migration period (Völkerwanderung) 150-500. Below the properties of HistoryMaps and its GUI are described in detail:
  • Shapes and timeline: The content of HistoryMaps is made up of shapes (in this example there are bezier-curved shapes which represent tribes), which may be morphed between time-keyframes. The time is displayed in the upper timeline, a current time is highlighted. You can click or drag with the mouse the timeline to set the current time, the shapes will be morphed according to this time. Thus you can explore historic constellations at different times.
  • Eventpoints: In addition to shapes there are eventpoints displayed, marking historic events (here battles). Eventpoints are drawn together with their corresponding times. If you move the mouse over a point additional information for that event is displayed. If you click an event point, the current time will be set to the corresponding time. Thus you see the global historic context of the event. This marks a virtue of the concept: In usual historic maps events are mostly drawn only with local context.
  • Animation: At startup and when you click the animation-button an animation is running, where current time moves over the timeline. This gives an overview of the history shown.
  • Timecolumns: When you click the timecolumn-button a static display is shown, where the shapes are drawn in columns of different times. Thus you see a picture of the historic content of all times at once. This gives insights on durations of historic developments, one can distinguish short processes that only appear in few columns from longlasting ones that are drawn in more columns.
  • Completeness: HistoryMaps may display the complete history of all places and all times. For this the current programm must be extended with zoom facility. Thus you could zoom in and out places (like GoogleMaps) and you could also zoom within the timeline to set a time frame of interest.

28.08.2010

Canvas graph demo, Usecase: Football results

On the left there is a interactive canvas graph demo, showing football results. You can switch highlighted graphs by mouse-clicking on the corresponding description. Since all the javascript is written in one line, all content of this blogpost could be uploaded to blogspot, there is no iframe needed here. Soon there will be a more advanced canvas demo and I'm also working on a webgl+bullet.js demo. Stay tuned! :)
Update: I made the graphs animate and added functionality: If the mouse moves over the graph, detail information is displayed.

10.05.2010

Canvas Game Demo: 4Rumble

As a small project besides a more complex 3d-project (soon more infos here) i wrote this game demo for canvas and javascript. Its a remake of a flash game demo, named 4Rumble (click, click), i made a while back. In this Javascript demo there is currently only one character, Cursor-Left/Right make him run around. Cursor-Up/Down zooms in and out. A formerly flash demo ported to javascript, might be seen as statement in the current html5-instead-of-flash debate. Which leads to:

Others stuff ramblings
My opinion about the Apple/Html5 vs. Flash debate (click, click): I dont have much to do with apple and i dont have much todo with flash. So im not directly affected. Obviously, Html5 is more open and accessible, than flash, so I love to see it gain ground. On the other side I strongly dislike vendor-lockin on Iphone (and elsewhere, e.g. linux-ban on ps3). It kills creativity, the user should have the choice between different technologies. If native apps are better than those (compiled) with intermediate code, they will supersede naturally other apps. There is no need for prohibition. If apple would allow flash (or more importantly imo: java) on its devices, I maybe also wanted to have one. :)
And now for sth. completely different: Google makes O3d a WebGl-Javascript-library, the plugin-development is stopped. This is imo a good step since with WebGl there wont be a need for a browser-3D-plugin. Though, WebGl doesnt currently run everywhere (i.e. on i.e.), but according to google the plugin will still be available for at least a year.

27.02.2010

Back from Cebu, Html5 game Sungka

I'm back from vacation. It was a very nice trip, here are three recommendations: Alta Cebu Resort - very nice place with internet and pool, Qatar Airways - tasty food, free beer and whiskey , Warped Passages - interesting book on particle physics, maybe a good read to understand coming LHC-experiments.

Working on new content: Games for Html5 (Canvas and/or WebGL). A first start is a implementation of the game Sungka using Javascript and Canvas (overall size 3.5kB). You can play it directly in the right field above. Currently it wont run on IE, only with e.g. firefox and chrome.

10.02.2010

Html5-Canvas with variable size

I tried to make a Html-page with a Canvas-element, which fills the whole page or browser window. Following line
<canvas width="100%" height="100%">
didnt work. It produced a canvas with a dimension of 100x100 pixels. Following
<canvas style="width:100%;height:100%" width="100%" height="100%">
worked a bit better: the canvas filled the browser window. Though the canvas still had a size of 100x100 pixels, but it was scaled up to fit the page. To have a canvas that dynamically changes its size according to the browser window, I had to set canvas.width and .height manually, like in this code snippet:
var cont=canvas.parentNode;
if ((canvas.width!=cont.clientWidth)||(canvas.height!=cont.clientHeight)) {
canvas.width=cont.clientWidth;
canvas.height=cont.clientHeight;}
Note: by setting e.g. canvas.width the canvas will be cleared, so the resize must take place before the repaint.

Update: If the canvas is used with WebGL, the gl-viewport must be set to the new size.
gl.viewport(0,0,canvas.width,canvas.height);